I’ve recently been looking at consolidating metrics from multiple Prometheus servers into one horizontally scalable central store. There’s plenty of open source options out there, with the most notable being Thanos, Cortex (now Mimir), Victoria Metrics, M3DB, etc.
I’ve managed to narrow my search down to Mimir and Victoria Metrics. The main reason for going with these two is that they offer support for more metric formats than just Prometheus, and while this isn’t a requirement, for my specific use case it’s a nice to have. Mimir has major support behind it through it’s creator, Grafana Labs, as well as the open source community surrounding Grafana and it’s umbrella of products. While Victoria Metrics isn’t quite as known as Grafana Labs or Mimir, it has plenty of open source support behind it, and an Enterprise offering there to maintain and build upon it.
It’s probably helpful to specify up front what I’m looking for in this evaluation.
- Scalability: My specific use case needs to handle a few hundred thousand metrics, but in the future it’s probable that this number would end up in the millions. So the solution needs to be able to scale as needed.
- Ease of management: Nobody wants to use something that is difficult to use. For instance, is scaling a difficult process? Is configuration and performance tuning difficult and/or time consuming? How stable is the platform?
- Performance: In particular, this will be latency for reads and writes, but includes CPU and Memory consumption as well.
The Test
Now this isn’t going to be a full blown performance test. I’ll be simulating a single Prometheus server with a few hundred thousand time series remote writing to both Mimir and Victoria Metrics. In order to simulate that, I’ll be using Avalanche to generate metrics, have Prometheus scrape Avalanche, and then configure Prometheus to remote write those to our backend.
The Avalanche container was spun up with the following Docker command:
docker run --name avalanche -p 9001:9001 quay.io/freshtracks.io/avalanche --metric-count=2000 --series-count=150 --label-count=5 --value-interval=10 --series-interval=86400 --metric-interval=86400This results in about 300 thousand active series, which rotate through a new set of series every day. For Prometheus, I made a configuration file like the following:
global:
  scrape_interval: 10s
  external_labels:
    cluster: loadtest
    namespace: loadtest

scrape_configs:
  - job_name: loadtest
    static_configs:
      - targets: [ 'host.docker.internal:9001' ]
        labels:
          pod: 'avalanche'
  - job_name: mimir
    static_configs:
      - targets: [ 'host.docker.internal:9009' ]

remote_write:
  - url: http://host.docker.internal:9009/api/v1/push
# Add X-Scope-OrgID header so that Mimir knows what tenant the remote write data should be stored in.
# In this case, our tenant is "loadtest"
    headers:
      X-Scope-OrgID: loadtest
And ran our Prometheus Docker container with:
docker run -d -p 9090:9090 --name prometheus -v /path/to/prometheus.yml:/etc/prometheus/prometheus.yml prom/prometheus:latest --config.file=/etc/prometheus/prometheus.yml
Grafana Mimir
If you’ve ever heard of Cortex, Mimir is the successor of that project in a sense. There’s two ways to run Mimir, microservices mode and monolithic mode. Both are horizontally scalable, the main difference is that monolithic mode packages all the individual components into one process. So instead of having several different microservice components to manage within a scalable cluster, you just have one component, and you scale that single component as required by your workload.
Given I’m after ease of management, I’ll be testing out the monolithic mode with 3 nodes. Obviously we’ll need something to distribute traffic between those nodes, so we’ll also be running Nginx as our load balancer. Mimir uses object storage such as S3 for the long term retention layer. I have MinIO running behind the scenes to act as an emulator for S3.
We’ll start with the Mimir configuration. This is what I ultimately decided was best for my test:
target: all,alertmanager,overrides-exporter

alertmanager_storage:
  backend: s3
  s3:
    endpoint: minio:9000
    access_key_id: mimir
    secret_access_key: supersecret
    insecure: true
    bucket_name: alertmanager

blocks_storage:
  backend: s3
  s3:
    endpoint: minio:9000
    access_key_id: mimir
    secret_access_key: supersecret
    insecure: true
    bucket_name: mimir
  tsdb:
    retention_period: 2160h0m0s

limits:
  max_global_series_per_user: 500000
  ingestion_rate: 500000

distributor:
  instance_limits:
    max_ingestion_rate: 0
    max_inflight_push_requests: 10000

ruler_storage:
  backend: s3
  s3:
    endpoint: minio:9000
    access_key_id: mimir
    secret_access_key: supersecret
    insecure: true
    bucket_name: ruler

memberlist:
  join_members: [ mimir-1, mimir-2, mimir-3 ]

ingester:
  ring:
    replication_factor: 1

server:
  log_level: warn
Most of this is the default configuration, but replication factor was turned down to 1 because I’m trying to get a performance baseline to compare with Victoria Metrics, since that will be running on a single node with no replication (more on this below). I also needed to increase ingestion rate limits since the defaults were a bit low.
The Nginx configuration just needed to distribute traffic to our Mimir nodes, so the configuration looked something like this:
events {
    worker_connections 1024;
}

http {
    upstream backend {
        server mimir-1:8080 max_fails=1 fail_timeout=1s;
        server mimir-2:8080 max_fails=1 fail_timeout=1s;
        server mimir-3:8080 max_fails=1 fail_timeout=1s backup;
    }

    server {
        listen 9009;
        access_log /dev/null;
        location / {
            proxy_pass http://backend;
        }
    }
}
And then a Docker compose file was used to put the Mimir stack together:
version: '3.4'
services:
  load-balancer:
    image: nginx:latest
    volumes:
      - ./config/nginx.conf:/etc/nginx/nginx.conf:ro
    restart: always
    depends_on:
      - "mimir-1"
      - "mimir-2"
      - "mimir-3"
    ports:
      - 9009:9009

  mimir-1:
    image: grafana/mimir:latest
    command: ["-config.file=/etc/mimir.yaml"]
    hostname: mimir-1
    restart: always
    volumes:
      - ./config/mimir.yaml:/etc/mimir.yaml
      - mimir-1-data:/data

  mimir-2:
    image: grafana/mimir:latest
    command: ["-config.file=/etc/mimir.yaml"]
    hostname: mimir-2
    restart: always
    volumes:
      - ./config/mimir.yaml:/etc/mimir.yaml
      - mimir-2-data:/data

  mimir-3:
    image: grafana/mimir:latest
    command: ["-config.file=/etc/mimir.yaml"]
    hostname: mimir-3
    restart: always
    volumes:
      - ./config/mimir.yaml:/etc/mimir.yaml
      - mimir-3-data:/data

volumes:
  mimir-1-data:
  mimir-2-data:
  mimir-3-data:
After standing up the stack, I was able to query Mimir and get the results one would expect. As far as resource usage goes, Mimir seems to want to use as much memory as you’ll give it, and it’s very CPU intensive as well. Running this entire Docker workload on an 8 core machine resulted in an average CPU utilization of 50 percent. The CPU aspect did seem a bit odd to me. Realistically you would think the Mimir cluster, especially a small 3 node cluster like this one, should use about the same amount of resources as the Prometheus instance remote writing to it. Prometheus is, after all, a time series database as well; both databases are processing the same data in this test. But the Mimir nodes would use several times as many CPU cycles as the single Prometheus instance feeding it metrics. I wouldn’t think this was abnormal had I not set the replication factor down to 1 for this test, but given that I did, I’m taking note of this.
Performance otherwise seemed good to me. Running queries that return large amounts of metrics always took less than a second. As far as ease of use and ease of management goes, scaling it up and down might be a little tedious without automating the scaling process, but certainly easier to scale than many other databases. The configuration file is quite extensive, and I had to do a bit of fine tuning after reading logs and finding that ingestion limits were causing metrics to be dropped. If someone had to trudge through the entire configuration parameters available and understand them all, it might take them a bit of time they’d rather spend on something else. I’d say ease of management is somewhere in the middle; there’s more to manage than a single Prometheus instance, but there’s certainly less to manage than an Elasticsearch cluster.
Victoria Metrics
I actually would’ve never considered Victoria Metrics had I not stumbled upon a random Hacker News thread where some were praising it for it’s performance and ease of use. After looking through their documentation, I was sold on giving it a try. One thing that stood out to me was the relatively simple architecture if you were running it in horizontally scalable cluster. However, the thing that really appealed to me was the performance results from a single node database.
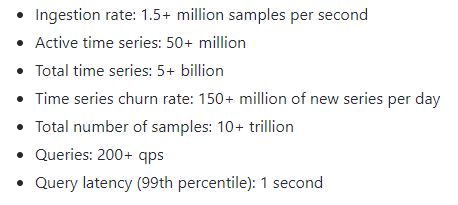
With these numbers, having horizontal scalability wouldn’t necessarily apply to me, because I’ll never get to the point where I’d need to scale horizontally with my use case.
Let’s get into the testing. To actually run Victoria Metrics, I was able to just run the Docker image.
docker run -d -p 8428:8428 -v /path/to/data:/victoria-metrics-data victoriametrics/victoria-metricsFrom here I pointed my Prometheus remote write to the Victoria Metrics node by updating the configuration a little bit.
global:
scrape_interval: 10s
external_labels:
cluster: loadtest
namespace: loadtest
scrape_configs:
- job_name: loadtest
static_configs:
- targets: [ 'host.docker.internal:9001' ]
labels:
pod: 'avalanche'
- job_name: victoria
static_configs:
- targets: [ 'host.docker.internal:8428' ]
remote_write:
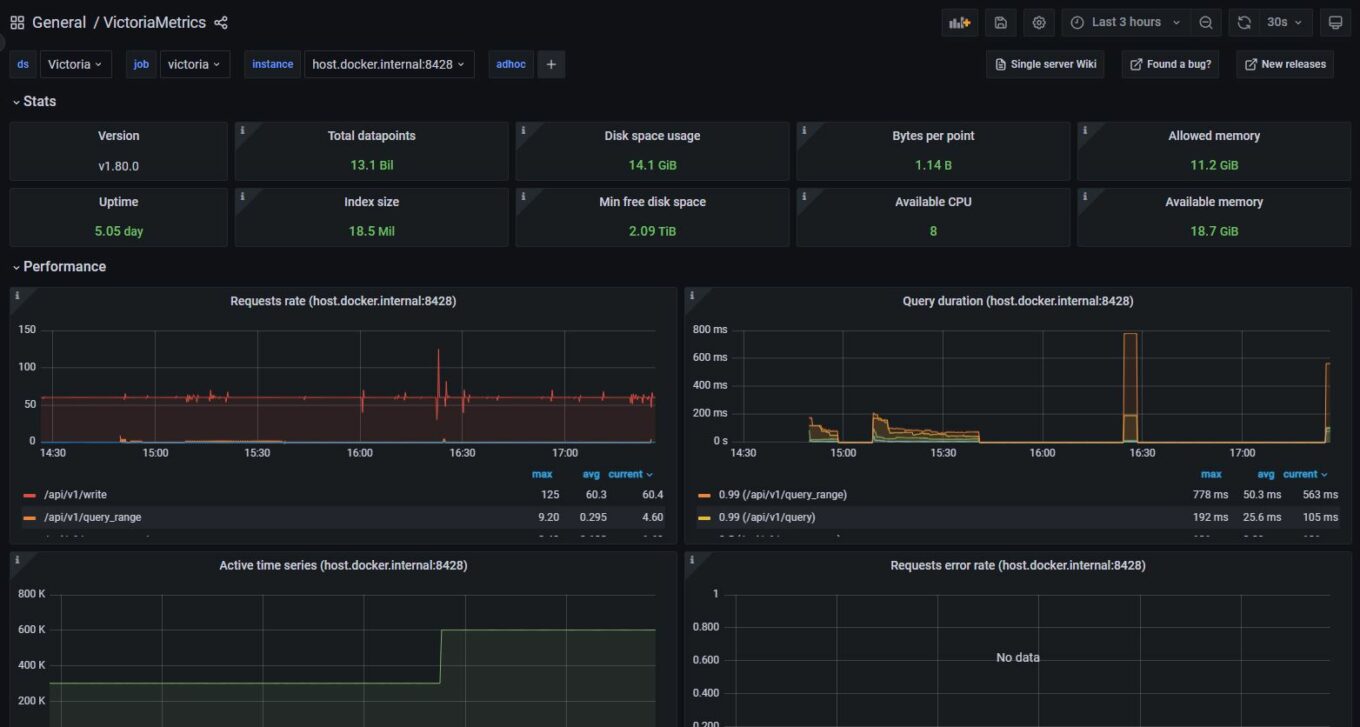
- url: http://host.docker.internal:8428/api/v1/writeAfter adding a Prometheus data source in Grafana pointed at http://host.docker.internal:8428 and importing a prebuilt dashboard for Victoria Metrics, I get something pretty like this:
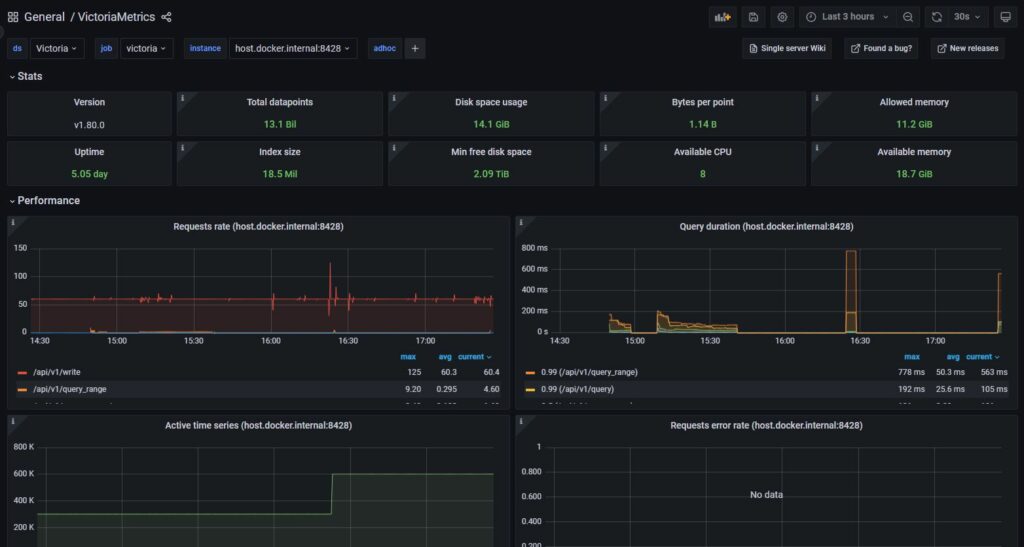
After letting it run for a few days, I can say I was actually really impressed with Victoria Metrics. Stability and performance didn’t seem like an issue at all. It tends to use as much memory as you’re willing to sacrifice (similar to Mimir) but CPU usage was very low. Very rarely does CPU utilization ever spike above using 1 full core. Similar to Mimir, disk I/O was low and the storage space used was similar.
Out of the scope of this post, but worth noting, is the simplicity of enabling Graphite metrics in Victoria Metrics. All it took was a command line flag and I was able to ingest Graphite metrics. Querying them required CarbonAPI to act as a middleman between Grafana and Victoria Metrics, but for those who have worked with Graphite before, you’ll know that this type of architecture is actually quite common and CarbonAPI is fairly painless to setup.
Conclusion
While both tools certainly met all the requirements I set forth, I ended up pursuing Victoria Metrics for the ease of use factor in my specific use case. If I needed to scale up to 1 billion active series, it’s possible that I may have gone a different route, but that would require a more in depth performance test.